Multiple Choice
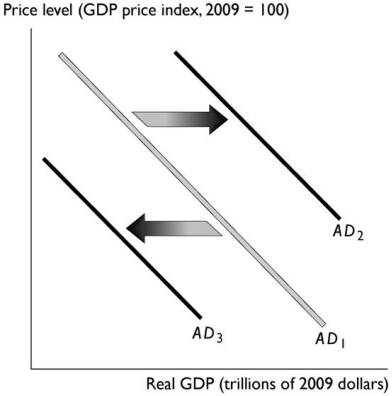
-In the figure above,the shift in the aggregate demand curve from AD₁ to AD₃ could be the result of an increase in
A) the price level.
B) foreign incomes.
C) the foreign exchange rate.
D) expected future income.
E) aggregate supply.
Correct Answer:

Verified
Correct Answer:
Verified
Q58: By itself, an increase in the price
Q75: Aggregate demand _ if the expected inflation
Q88: A rise in the price level _
Q89: The Reserve Bank responds to an increase
Q90: Cost-push inflation can be started by<br>A)a decrease
Q91: Because there is a _ relationship between
Q92: <img src="https://d2lvgg3v3hfg70.cloudfront.net/TB1012/.jpg" alt=" The table
Q95: The quantity of real GDP supplied increases
Q96: A demand-pull inflation initially is characterised by<br>A)decreasing
Q98: Potential GDP<br>A)might either increase or decrease as