Multiple Choice
 The figure above shows two aggregate expenditure lines.
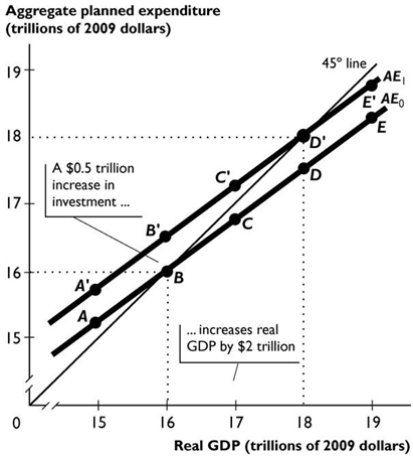
-In the figure above, if the marginal propensity to import increased, the aggregate expenditure lines would ________ and the multiplier would ________ in value.
A) become less steep; fall
B) become less steep; rise
C) not change; fall
D) become steeper; rise
E) not change; rise
Correct Answer:

Verified
Correct Answer:
Verified
Q23: If the slope of the aggregate expenditure
Q24: If the MPC is 0.6 and there
Q25: <img src="https://d2lvgg3v3hfg70.cloudfront.net/TB8401/.jpg" alt=" -The table above
Q26: During 2018, a country has consumption expenditures
Q27: <img src="https://d2lvgg3v3hfg70.cloudfront.net/TB8401/.jpg" alt=" -In the figure
Q29: <img src="https://d2lvgg3v3hfg70.cloudfront.net/TB8401/.jpg" alt=" The figure above
Q30: The size of the expenditure multiplier is
Q31: <img src="https://d2lvgg3v3hfg70.cloudfront.net/TB8401/.jpg" alt=" -The above table
Q32: The consumption function shows the relationship between<br>A)
Q33: If an increase of $10 billion in