Multiple Choice
Figure 13-4A
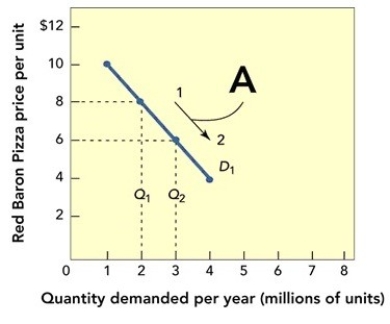
-Figure 13-4A above shows that when the price for Red Baron frozen cheese pizzas moves from $8 to $6 per unit along the demand curve D₁,the profit
A) increases from 6 to 8 million units per year.
B) decreases from 8 to 6 million units per year.
C) stays the same.
D) increases from $2 to $3 per unit.
E) cannot be determined;demand curves do not show a relationship to profit.
Correct Answer:

Verified
Correct Answer:
Verified
Q34: SHAPE magazine is targeted at young women
Q60: The sum of the expenses of a
Q136: Figure 13-5<br> <img src="https://d2lvgg3v3hfg70.cloudfront.net/TB1242/.jpg" alt="Figure 13-5
Q139: Which of the following best illustrates a
Q140: Which of the following would be an
Q144: A break-even chart is a graphic presentation<br>A)that
Q146: Given that a firm's profit is high
Q160: You are president of an electric appliances
Q179: The practice of simultaneously increasing product and
Q181: In a snack vending machine, consumers can