Multiple Choice
Figure 13-4B
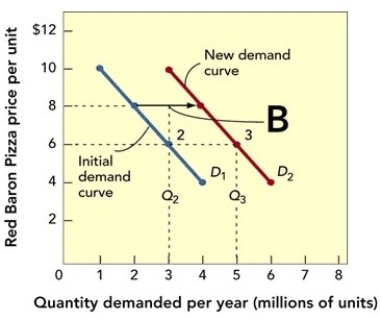
-In Figure 13-4B above,the demand curve shifts from D₂ to D₃ (B) .This most likely represents
A) an increase in demand resulting from competitor or consumer changes.
B) an increase in demand that required a decrease in price.
C) no change in price and no change in demand.
D) no change in demand or price but a greater profit due to economies of scale.
E) a decrease in price from $8 to $6 per unit.
Correct Answer:

Verified
Correct Answer:
Verified
Q18: The break-even point for a large grain
Q123: Describe the pricing constraints a firm is
Q143: Washburn Guitars markets its guitars to four
Q163: Figure 13-5<br> <img src="https://d2lvgg3v3hfg70.cloudfront.net/TB1242/.jpg" alt="Figure 13-5
Q164: Which of the following would be an
Q165: A maximizing current profit objective implies that
Q168: VIZIO's HDTVs are sold through all of
Q169: George and Alice Renfro decided to start
Q217: You are selling a new line of
Q227: The quantity at which total revenue and