Multiple Choice
Figure 13-6
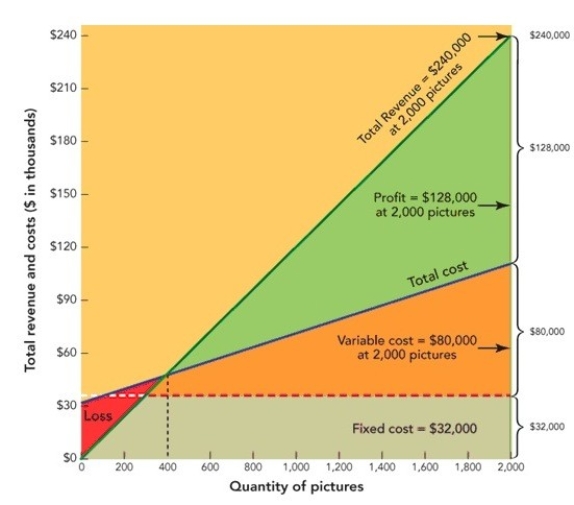
-Figure 13-6 above depicts a
A) Gantt chart.
B) demand curve.
C) break-even chart.
D) ROI analysis.
E) cross-tabulation.
Correct Answer:

Verified
Correct Answer:
Verified
Related Questions
Q30: Suppose you are the owner of a
Q85: Marketers may engage in value pricing, which
Q144: A break-even chart is a graphic presentation<br>A)that
Q146: Given that a firm's profit is high
Q149: VIZIO is the market leader in the
Q150: Figure 13-3<br> <img src="https://d2lvgg3v3hfg70.cloudfront.net/TB1242/.jpg" alt="Figure 13-3
Q151: Value pricing refers to<br>A)the ratio of perceived
Q179: The practice of simultaneously increasing product and
Q181: In a snack vending machine, consumers can
Q188: An analysis of a prospective product shows