Multiple Choice
Figure 13-7
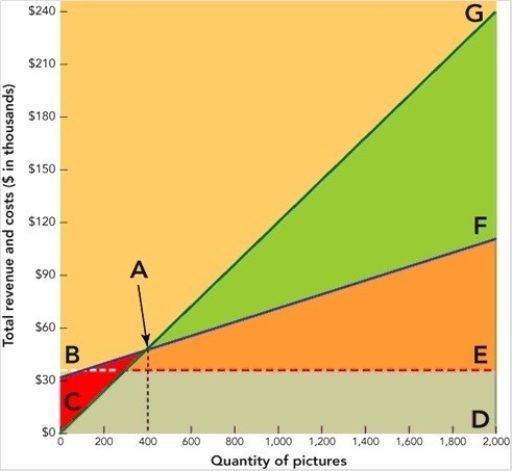
-In the break-even chart in Figure 13-7 above,the triangular area FBE represents the firm's
A) fixed costs.
B) break-even point.
C) variable costs.
D) profit.
E) total revenue.
Correct Answer:

Verified
Correct Answer:
Verified
Related Questions
Q6: Specifying the role of price in an
Q16: Calculate a firm's profit using the following
Q33: Which of the following is an example
Q34: A firm's profit equals<br>A)Total cost + Total
Q36: Elastic demand exists when<br>A) a small percentage
Q66: What is the difference between fixed costs
Q100: Pure competition is the competitive situation in
Q119: The formula Total revenue − Total cost
Q158: A reference value involves comparing the costs
Q171: To increase value, marketers may _, decrease