Multiple Choice
Figure 13-7
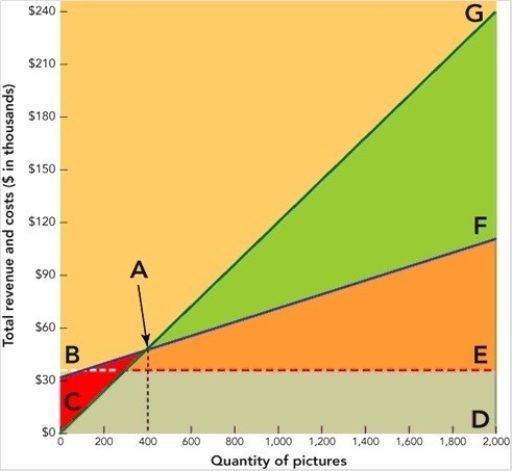
-In the break-even chart in Figure 13-7 above,the line CG represents the firm's
A) fixed costs.
B) break-even point.
C) variable costs.
D) profit.
E) total revenue.
Correct Answer:

Verified
Correct Answer:
Verified
Related Questions
Q27: Figure 13-7<br> <img src="https://d2lvgg3v3hfg70.cloudfront.net/TB1242/.jpg" alt="Figure 13-7
Q31: Which of the following statements would most
Q33: Which of the following is an example
Q34: A firm's profit equals<br>A)Total cost + Total
Q41: While pricing objectives frequently reflect corporate goals,
Q88: The competitive market situation in which many
Q90: When estimating demand, price is not the
Q100: Pure competition is the competitive situation in
Q152: At one point, people were willing to
Q228: Factors other than price affect demand. What