Multiple Choice
The graph in Figure 22.3 depicts four possible patterns for the abundance of 3TC-resistant HIV within an infected human over time.
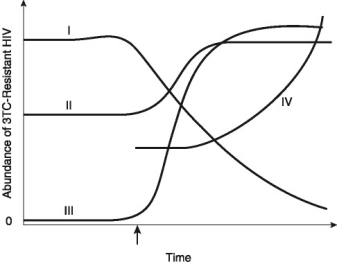
-If 3TC resistance is costly for HIV, then which plot (I-IV) best represents the response of a strain of 3TC-resistant HIV over time, if 3TC administration begins at the time indicated by the arrow?
A) I
B) II
C) III
D) IV
Correct Answer:

Verified
Correct Answer:
Verified
Q5: It has been observed that organisms on
Q19: The following questions refer to the evolutionary
Q20: Of the following anatomical structures, which is
Q23: In the mid-1900s, the Soviet geneticist Lysenko
Q25: Logically, which of these should cast the
Q26: In Darwin's thinking, the more closely related
Q27: Which statement about natural selection is most
Q28: Which of the following is not an
Q29: As a young biologist, Charles Darwin had
Q44: Given a population that contains genetic variation,