menu-iconExamlexExamLexServices

Discover

Ask a Question
  1. All Topics
  2. Topic
    Biology
  3. Study Set
    Biology
  4. Exam
    Exam 26: Phylogeny and the Tree of Life
  5. Question
    Which Curve in the Graph Below Best Depicts the Way
Solved

Which Curve in the Graph Below Best Depicts the Way

Question 70

Question 70

Short Answer

Which curve in the graph below best depicts the way that mutation rate varies over time in a gene that can serve as a reliable molecular clock?
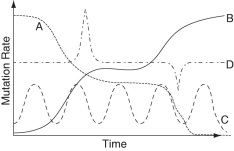
Correct Answer:

verifed

Verified

Unlock this answer now
Get Access to more Verified Answers free of charge

Related Questions

Q65: Darwin analogized the effects of evolution as

Q66: The following questions refer to the

Q67: A large proportion of archaeans are "extremophiles,"

Q68: Use Figure 26.1 to answer the following

Q69: The following questions refer to the

Q71: In a comparison of birds with mammals,

Q72: The following questions refer to the

Q73: The HIV genome's reliably high rate of

Q74: The following questions refer to this phylogenetic

Q75: The following questions refer to the

Examlex

ExamLex

About UsContact UsPerks CenterHomeschoolingTest Prep

Work With Us

Campus RepresentativeInfluencers

Links

FaqPricingChrome Extension

Download The App

Get App StoreGet Google Play

Policies

Privacy PolicyTerms of ServiceHonor CodeCommunity Guidelines

Scan To Download

qr-code

Copyright © (2025) ExamLex LLC.

Privacy PolicyTerms Of ServiceHonor CodeCommunity Guidelines