Multiple Choice
The following questions refer to the table below, which compares the % sequence homology of four different parts (2 introns and 2 exons) of a gene that is found in five different eukaryotic species. Each part is numbered to indicate its distance from the promoter (e.g., Intron I is that closest to the promoter) . The data reported for Species A were obtained by comparing DNA from one member of species A to another member of Species A.
-Based on the tabular data, and assuming that time advances vertically, which cladogram (a type of phylogenetic tree) is the most likely depiction of the evolutionary relationships among these five species?
A) 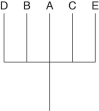
B) 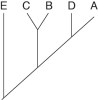
C) 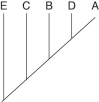
D) 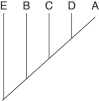
Correct Answer:

Verified
Correct Answer:
Verified
Q19: The next questions refer to the following
Q43: Which eukaryotic kingdom includes members that are
Q53: The following questions refer to the hypothetical
Q54: The following questions refer to the
Q55: The relative lengths of the amphibian and
Q56: The following questions refer to the
Q59: Neutral theory proposes that<br>A)molecular clocks are more
Q60: The common housefly belongs to all of
Q61: The following questions refer to the hypothetical
Q62: Which of the following pairs are the