Multiple Choice
The following questions refer to Figure 27.1 below, which is the same as Figure 27.10 in the textbook.
In this 8-year experiment, 12 populations of E. coli, each begun from a single cell, were grown in low-glucose conditions for 20,000 generations. Each culture was introduced to fresh growth medium every 24 hours. Occasionally, samples were removed from the populations, and their fitness in low-glucose conditions was tested against that of members sampled from the ancestral (common ancestor) E. coli population.
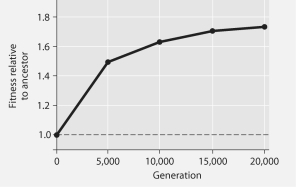
Figure 27.1
-Which of these can be inferred from Figure 27.1?
A) Most of the genetic change that permitted adaptation to the new, low-glucose environment occurred toward the conclusion of the experiment.
B) Rates of mitosis increased over the course of the experiment.
C) The highest rate of genetic change occurred during the first quarter of the experiment.
D) After 5,000 generations, the bacteria were 100% more fit than the original, ancestral bacteria.
Correct Answer:

Verified
Correct Answer:
Verified
Q6: Assuming that each of these possesses a
Q14: If archaeans are more closely related to
Q22: Figure 27.2 depicts changes to the amount
Q23: Which of the following features of prokaryotic
Q24: The following questions refer to Figure 27.1
Q26: The following questions refer to structures found
Q29: If a bacterium regenerates from an endospore
Q30: Consider the thermoacidophile, Sulfolobus acidocaldarius. Which
Q32: In a bacterium that possesses antibiotic resistance
Q70: Genetic variation in bacterial populations cannot result