Multiple Choice
The data were collected from the heterocytes of a nitrogen-fixing cyanobacterium inhabiting equatorial ponds. Study the graph below and choose the most likely explanation for the shape of the curve. 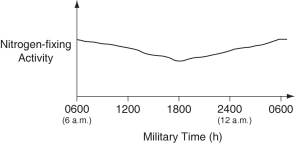
A) Enough O₂ enters heterocytes during hours of peak photosynthesis to have a somewhat-inhibitory affect on nitrogen fixation.
B) Light-dependent reaction rates must be highest between 1800 hours and 0600 hours.
C) Atmospheric N₂ levels increase at night because plants are no longer metabolizing this gas, so are not absorbing this gas through their stomata.
D) Heterocyte walls become less permeable to N₂ influx during darkness.
E) The amount of fixed nitrogen that is dissolved in the pond water in which the cyanobacteria are growing peaks at the close of the photosynthetic day (1800 h) .
Correct Answer:

Verified
Correct Answer:
Verified
Q7: Carl Woese and collaborators identified two major
Q10: The following questions refer to structures found
Q11: The following questions refer to Figure 27.1
Q12: Prokaryotic ribosomes differ from those present in
Q13: Mycoplasmas are bacteria that lack cell walls.
Q14: Regarding prokaryotic reproduction, which statement is correct?<br>A)Prokaryotes
Q18: Which is the bacterial structure that acts
Q24: Though plants, fungi, and prokaryotes all have
Q35: Figure 27.2 depicts changes to the amount
Q77: Which two structures play direct roles in