Multiple Choice
Figure 21-3 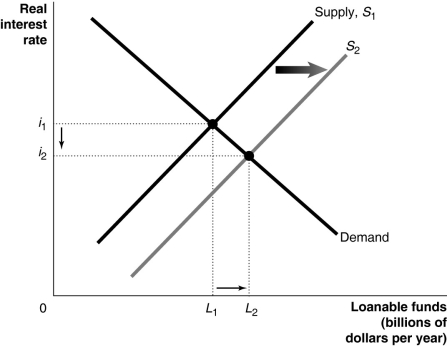
-Refer to Figure 21-3.Which of the following is consistent with the graph depicted above?
A) Taxes are changed so that real interest income is taxed rather than nominal interest income.
B) An expected recession decreases the profitability of new investment.
C) The government runs a budget deficit.
D) Technological change increases the profitability of new investment.
Correct Answer:

Verified
Correct Answer:
Verified
Q6: Since the 1950s<br>A)the United States has not
Q23: Which of the following explains the cause
Q30: Table 21-1<br> <span class="ql-formula" data-value="\begin{array}
Q31: The Congressional Budget Office reported that federal
Q72: Figure 21-6 <img src="https://d2lvgg3v3hfg70.cloudfront.net/TB7397/.jpg" alt="Figure 21-6
Q114: Explain and show graphically how an increase
Q131: Increases in capital per hour worked cannot
Q159: An increase in the real interest rate
Q167: When the economy enters a recessionary phase
Q245: How does a decrease in the tax