Multiple Choice
Figure 24-4 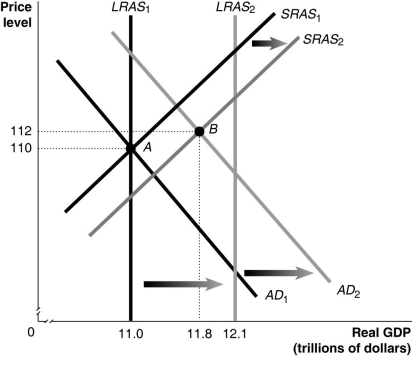
-Refer to Figure 24-4. Given the economy is at point A in year 1, what is the inflation rate between year 1 and year 2?
A) 0.9%
B) 1.8%
C) 2.7%
D) 3.0%
Correct Answer:

Verified
Correct Answer:
Verified
Q30: One factor which brought on the recession
Q69: Interest rates in the economy have fallen.How
Q77: At the beginning of the recession of
Q92: Explain how each of the following events
Q96: If aggregate demand just increased,which of the
Q159: An increase in imports increases aggregate demand.
Q190: Proponents of the real business cycle model
Q204: At a short-run macroeconomic equilibrium,real GDP is
Q253: Figure 24-3 <img src="https://d2lvgg3v3hfg70.cloudfront.net/TB7397/.jpg" alt="Figure 24-3
Q257: Figure 24-4 <img src="https://d2lvgg3v3hfg70.cloudfront.net/TB7397/.jpg" alt="Figure 24-4