Essay
Table 2-2
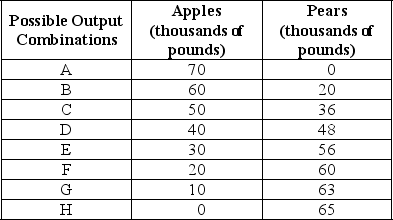
-Refer to Table 2-2.The Fruit Farm produces only apples and pears.The table above shows the maximum possible output combinations of the two fruits using all resources and currently available technology.
a.Graph The Fruit Farm's production possibilities frontier.Put apples on the horizontal axis and pears on the vertical axis.Be sure to identify the output combination points on your diagram.
b.Suppose The Fruit Farm is currently producing at point D.What is the opportunity cost of producing an additional 8,000 pounds of pears?
c.Suppose The Fruit Farm is currently producing at point D.What happens to the opportunity cost of producing more and more pears? Does it increase,decrease or remain constant? Explain your answer.
d.Suppose The Fruit Farm is currently producing at point G.What happens to the opportunity cost of producing more and more apples? Does it increase,decrease or remain constant? Explain your answer.
e.Suppose The Fruit Farm is plagued by the apple maggot infestation which destroys apple trees but not pears.Show in a graph what happens to its PPF.
Correct Answer:

Verified
a.

b.10,000 pounds of apples
c.It inc...View Answer
Unlock this answer now
Get Access to more Verified Answers free of charge
Correct Answer:
Verified
b.10,000 pounds of apples
c.It inc...
View Answer
Unlock this answer now
Get Access to more Verified Answers free of charge
Q1: An outward shift of a nation's production
Q40: The production possibilities frontier shows the _
Q51: In the circular flow model, producers<br>A)sell goods
Q115: Increasing opportunity cost is represented by a
Q121: Figure 2-7<br> <img src="https://d2lvgg3v3hfg70.cloudfront.net/TB2849/.jpg" alt="Figure 2-7
Q185: The points outside the production possibilities frontier
Q225: What shape does a production possibilities frontier
Q228: Bella can produce either a combination of
Q246: In a free market there are virtually
Q256: Figure 2-4<br> <img src="https://d2lvgg3v3hfg70.cloudfront.net/TB4193/.jpg" alt="Figure 2-4