Multiple Choice
Figure 2-8
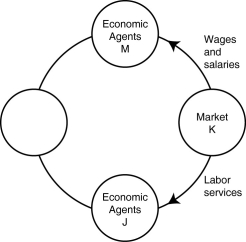
-Refer to Figure 2-8.One segment of the circular flow diagram in the figure shows the flow of wages and salaries from market K to economic agents M.What is market K and who are economic agents M?
A) K = factor markets; M = households
B) K = product markets; M = households
C) K = factor markets; M = firms
D) K = product markets; M = firms
Correct Answer:

Verified
Correct Answer:
Verified
Q30: Table 2-4<br> <img src="https://d2lvgg3v3hfg70.cloudfront.net/TB2849/.jpg" alt="Table 2-4
Q31: Table 2-4<br> <img src="https://d2lvgg3v3hfg70.cloudfront.net/TB2849/.jpg" alt="Table 2-4
Q32: Figure 2-11<br> <img src="https://d2lvgg3v3hfg70.cloudfront.net/TB2849/.jpg" alt="Figure 2-11
Q35: Figure 2-11<br> <img src="https://d2lvgg3v3hfg70.cloudfront.net/TB2849/.jpg" alt="Figure 2-11
Q36: Figure 2-7<br> <img src="https://d2lvgg3v3hfg70.cloudfront.net/TB2849/.jpg" alt="Figure 2-7
Q105: A decrease in the unemployment rate may
Q126: If a country is producing efficiently and
Q134: The production possibilities frontier model shows that<br>A)if
Q229: Specializing in the production of a good
Q377: If the best surgeon in town is