Multiple Choice
Figure 2-10
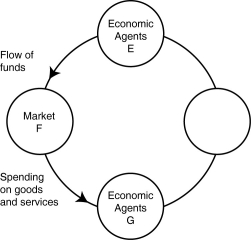
-Refer to Figure 2-10.One segment of the circular flow diagram in the figure shows the flow of funds from economic agents E to market F.Who are economic agents E and what is market F?
A) E = households; F = product markets
B) E = firms; F = product markets
C) E = households ; F = factor markets
D) E = firms; F = factor markets
Correct Answer:

Verified
Correct Answer:
Verified
Q2: Figure 2-11<br> <img src="https://d2lvgg3v3hfg70.cloudfront.net/TB2849/.jpg" alt="Figure 2-11
Q3: Figure 2-6<br> <img src="https://d2lvgg3v3hfg70.cloudfront.net/TB2849/.jpg" alt="Figure 2-6
Q8: Table 2-4<br> <img src="https://d2lvgg3v3hfg70.cloudfront.net/TB2849/.jpg" alt="Table 2-4
Q25: Without an increase in the supplies of
Q28: Figure 2-2<br> <img src="https://d2lvgg3v3hfg70.cloudfront.net/TB4193/.jpg" alt="Figure 2-2
Q42: Which of the following are separate flows
Q122: Table 2-1<br>Production choices for Tomaso's Trattoria<br> <img
Q155: Figure 2-11 <img src="https://d2lvgg3v3hfg70.cloudfront.net/TB4188/.jpg" alt="Figure 2-11
Q173: Figure 2.7<br> <img src="https://d2lvgg3v3hfg70.cloudfront.net/TB3087/.jpg" alt="Figure 2.7
Q201: If the production possibilities frontier is _,