Multiple Choice
Figure 3-8
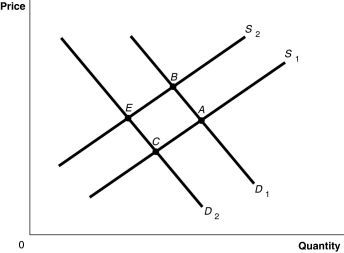
-Refer to Figure 3-8.The graph in this figure illustrates an initial competitive equilibrium in the market for apples at the intersection of D1 and S1 (point A) If there is a shortage of apples how will the equilibrium point change?
A) The equilibrium point will move from A to B.
B) The equilibrium point will move from A to C.
C) There will be no change in the equilibrium point.
D) The equilibrium point will move from A to E.
Correct Answer:

Verified
Correct Answer:
Verified
Q24: Auctions in recent years have resulted in
Q27: If the number of firms producing mouthwash
Q42: At a product's equilibrium price<br>A)the product's demand
Q49: How does the increasing use of MP3
Q79: An increase in the number of firms
Q101: The demand for lobster is higher in
Q171: Market equilibrium occurs where supply equals demand.
Q214: The following appeared in a Florida newspaper
Q237: In response to a surplus the market
Q433: Figure 3-6 <img src="https://d2lvgg3v3hfg70.cloudfront.net/TB4188/.jpg" alt="Figure 3-6