Multiple Choice
Figure 3-8
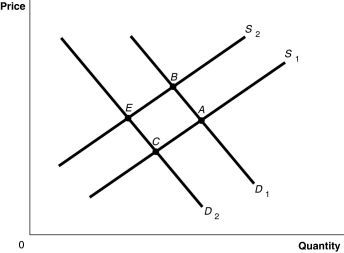
-Refer to Figure 3-8.The graph in this figure illustrates an initial competitive equilibrium in the market for apples at the intersection of D2 and S2 (point E) Which of the following changes would cause the equilibrium to change to point A?
A) A positive change in the technology used to produce apples and decrease in the price of oranges, a substitute for apples.
B) An increase in the wages of apple workers and a decrease in the price of oranges, a substitute for apples.
C) An increase in the number of apple producers and a decrease in the number of apple trees as a result of disease.
D) A decrease in the wages of apple workers and an increase in the price of oranges, a substitute for apples.
Correct Answer:

Verified
Correct Answer:
Verified
Q15: In the United States during the recession
Q18: Which of the following would cause a
Q51: What is the difference between an "increase
Q69: If an increase in income leads to
Q110: Figure 3-7<br> <img src="https://d2lvgg3v3hfg70.cloudfront.net/TB4193/.jpg" alt="Figure 3-7
Q146: What is the ceteris paribus condition?
Q207: The income effect explains why there is
Q209: Olive oil producers want to sell more
Q227: Which of the following would cause the
Q350: For each of the following pairs of