Multiple Choice
Figure 1-1 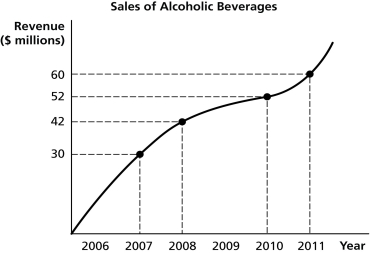
-Refer to Figure 1-1.Using the information in the figure above,calculate the percentage change in sales of alcoholic beverages between 2008 and 2010.
A) 23.8%
B) 40%
C) 42.9%
D) 73.3%
Correct Answer:

Verified
Correct Answer:
Verified
Related Questions
Q21: All economic questions arise from the fact
Q38: Which of the following is an example
Q45: In a market economy,those who are willing
Q98: Which of the following is a positive
Q111: Which of the following statements about positive
Q124: Which of the following is a normative
Q159: Figure 1-3 <img src="https://d2lvgg3v3hfg70.cloudfront.net/TB1236/.jpg" alt="Figure 1-3
Q167: Define allocative efficiency.Explain the significance of this
Q177: In the market for factors of production,households
Q195: When goods and services are produced at