Multiple Choice
Figure 9-1
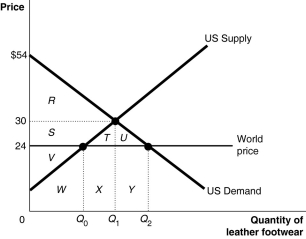
Figure 9-1 shows the U.S. demand and supply for leather footwear.
-Refer to Figure 9-1.Under autarky,the equilibrium price is ________,the consumer surplus is ________ and the producer surplus is ________.
A) $30; consumer surplus = area R; producer surplus = area S + V
B) $30; consumer surplus = area R + S + V; producer surplus = area T + W+ X
C) $24; consumer surplus = area R + S; producer surplus = area V
D) $30; consumer surplus = area R; producer surplus = area S + T + V + W + X
Correct Answer:

Verified
Correct Answer:
Verified
Q16: Suppose in Vietnam a worker can produce
Q18: The 1994 agreement that eliminated most tariffs
Q19: a.Define the term "globalization."<br>b.Describe the benefits of
Q37: China has developed a comparative advantage in
Q80: Table 9-1<br> <img src="https://d2lvgg3v3hfg70.cloudfront.net/TB2849/.jpg" alt="Table 9-1
Q87: Under trade agreements signed with other countries,the
Q127: Automobiles and many other products are differentiated.As
Q161: All but one of the following statements
Q174: What are terms of trade?
Q205: Figure 9-3 <img src="https://d2lvgg3v3hfg70.cloudfront.net/TB7397/.jpg" alt="Figure 9-3