Multiple Choice
Figure 9-1
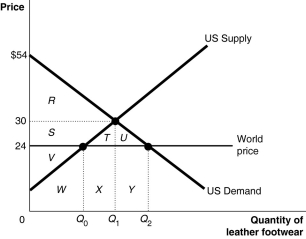
Figure 9-1 shows the U.S. demand and supply for leather footwear.
-Refer to Figure 9-1.Suppose the government allows imports of leather footwear into the United States.The market price falls to $24.What areas represent consumer surplus and domestic producer surplus?
A) Consumer surplus = R + S; producer surplus = V.
B) Consumer surplus = R + S + T + U; producer surplus = V.
C) Consumer surplus = R + S + T + U; producer surplus = V + W + X + Y.
D) Consumer surplus = R + S + T; producer surplus = W + X + Y.
Correct Answer:

Verified
Correct Answer:
Verified
Q7: The United States would gain from the
Q17: The first example of comparative advantage appeared
Q35: Which of the following statements is true?<br>A)Economic
Q65: More than half of Caterpillar's sales are
Q70: Figure 9-2<br> <img src="https://d2lvgg3v3hfg70.cloudfront.net/TB2849/.jpg" alt="Figure 9-2
Q119: In the past two decades the United
Q143: Trade restrictions are often motivated by a
Q175: How does the U.S.federal government assist workers
Q295: Figure 9-3 <img src="https://d2lvgg3v3hfg70.cloudfront.net/TB4188/.jpg" alt="Figure 9-3
Q347: Figure 9-3 <img src="https://d2lvgg3v3hfg70.cloudfront.net/TB7397/.jpg" alt="Figure 9-3