Multiple Choice
Table 20-1
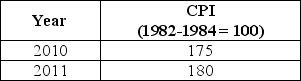
-Refer to Table 20-1.Suppose that the data in the table above reflect price levels in the economy.What is the inflation rate between 2010 and 2011?
A) 2.9%
B) 3.5%
C) 4.6%
D) 5%
E) 7.5%
Correct Answer:

Verified
Correct Answer:
Verified
Related Questions
Q24: The base period for CPI calculations is
Q39: People who lost their jobs as hand-drawn
Q73: Emma is a road construction worker.During the
Q106: Jack just told his boss that he
Q110: To obtain real average hourly earnings,nominal average
Q114: Figure 20-1 <img src="https://d2lvgg3v3hfg70.cloudfront.net/TB7397/.jpg" alt="Figure 20-1
Q144: Unemployment arising from a persistent mismatch between
Q171: If consumers purchase fewer of those products
Q178: If the CPI falls from 142 to
Q251: If the number of unemployed workers is