Multiple Choice
Table 20-10
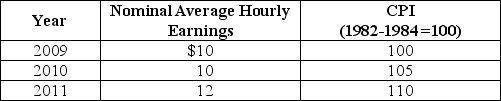
-Refer to Table 20-10.Looking at the table above,what is the approximate rate of growth of real average hourly earnings from 2009 to 2010?
A) 15%
B) 4.4%
C) -1.5%
D) -4.8%
Correct Answer:

Verified
Correct Answer:
Verified
Related Questions
Q7: By offering training to workers whose firms
Q12: Table 20-7<br> <img src="https://d2lvgg3v3hfg70.cloudfront.net/TB2849/.jpg" alt="Table 20-7
Q14: How could a growing labor force lead
Q21: In September 2011,Bank of America laid off
Q129: Which of the following would reduce the
Q142: The household survey asks adults about their
Q192: Jack was unemployed two weeks ago but
Q247: You borrow $10,000 from a bank for
Q251: If the number of unemployed workers is
Q266: Suppose 180,000 people are employed,20,000 people are