Multiple Choice
Figure 24-4
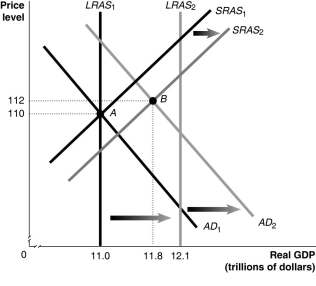
-Refer to Figure 24-4. In the figure above,AD₁, LRAS₁ and SRAS₁ denote AD,LRAS and SRAS in year 1,while AD₂,LRAS₂ and SRAS₂ denote AD,LRAS and SRAS in year 2. Given the economy is at point A in year 1,what is the actual growth rate in GDP in year 2?
A) 2.5%
B) 7.3%
C) 8.0%
D) 10.0%
Correct Answer:

Verified
Correct Answer:
Verified
Q13: If aggregate demand just decreased,which of the
Q64: Figure 24-2<br> <img src="https://d2lvgg3v3hfg70.cloudfront.net/TB2849/.jpg" alt="Figure 24-2
Q67: The _ curve has a positive slope
Q76: Inflation is generally the result of total
Q93: An adverse supply shock causes the short-run
Q149: The short-run aggregate supply curve has a<br>A)negative
Q178: According to the "wealth effect," when the
Q192: Workers expect inflation to fall from 4%
Q240: A rapid increase in the price of
Q273: When people became _ concerned with the