Multiple Choice
Figure 27-2
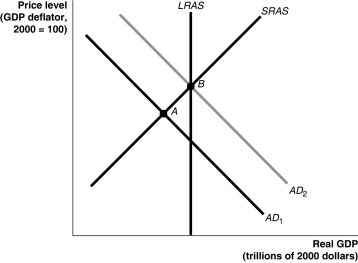
-Refer to Figure 27-2.In the graph above,suppose the economy is initially at point A.The movement of the economy to point B as shown in the graph illustrates the effect of which of the following policy actions by the Congress and the president?
A) a decrease in income taxes
B) a decrease in interest rates
C) a decrease in government purchases
D) an increase in the money supply
Correct Answer:

Verified
Correct Answer:
Verified
Q142: An increase in government spending will force
Q172: A decrease in individual income taxes _
Q210: Prior to the 1930s,the majority of dollars
Q214: In preparing their estimates of the stimulus
Q217: What is the difference between federal purchases
Q260: The federal budget exhibited a $128.7 billion
Q265: The federal budget deficit acts as an
Q269: Which of the following statements about the
Q293: President Bush lowered taxes on capital gains
Q306: Suppose real GDP is $14 trillion and