Multiple Choice
Figure 29-3
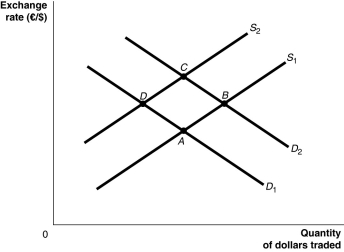
-Refer to Figure 29-3. The depreciation of the euro is represented as a movement from
A) D to A.
B) C to D.
C) B to C.
D) B to A.
Correct Answer:

Verified
Correct Answer:
Verified
Q62: Table 29-2<br> <img src="https://d2lvgg3v3hfg70.cloudfront.net/TB2849/.jpg" alt="Table 29-2
Q64: A decrease in the demand for U.S.assets
Q67: Figure 29-3<br> <img src="https://d2lvgg3v3hfg70.cloudfront.net/TB2849/.jpg" alt="Figure 29-3
Q123: Currency traders expect the value of the
Q142: National saving equals<br>A)income - taxes - consumption.<br>B)taxes
Q168: Net foreign investment is a measure of
Q169: When exchange rates are _,we say that
Q219: Explain and show graphically the effect of
Q220: In international exchange markets,a rise in interest
Q236: Assuming no change in the nominal exchange