Multiple Choice
The type of graph depicted below is a 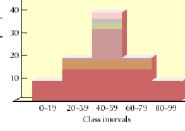
A) frequency polygon.
B) scatter diagram.
C) normal distribution.
D) histogram.
Correct Answer:

Verified
Correct Answer:
Verified
Related Questions
Q48: If the points on a scatter diagram
Q49: In order to convert a number to
Q50: Students' hat sizes and their college grades
Q51: Which of the following correlations is depicted
Q52: Melissa is using the three measures of
Q54: The scatter diagram below depicts which type
Q55: Which of the following correlation coefficients indicates
Q56: Which of the following is made by
Q57: If two variables have a correlation of
Q58: The fewer days that students attend class,the