Multiple Choice
The type of graph depicted below is a 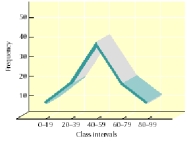
A) scatter matrix.
B) histogram.
C) frequency polygon.
D) correlation matrix.
Correct Answer:

Verified
Correct Answer:
Verified
Related Questions
Q5: Measures of variability belong to which of
Q6: A graph that plots the intersection of
Q7: For a correlation of +1.00 or -1.00,what
Q8: Histograms and frequency polygons are visual representations
Q9: Dr.Sandford indicates the frequencies of his data
Q11: Which of the following is NOT an
Q12: Representativeness as it refers to a sample
Q13: Which type of statistics are used for
Q14: Cara is plotting a zero correlation as
Q15: A histogram can be described as a