Multiple Choice
The distribution depicted below is a 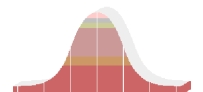
A) histogram.
B) positive skew.
C) negative skew.
D) normal curve.
Correct Answer:

Verified
Correct Answer:
Verified
Related Questions
Q146: On a normal curve,99 percent of all
Q147: If the mean on a test is
Q148: After administering a unit test to her
Q149: Gabe had a score of 70 in
Q150: A perfect negative relationship has a coefficient
Q152: The range is a measure of<br>A) central
Q153: A single number that describes a "middle
Q154: The scatter diagram below depicts which type
Q155: Regarding frequency distributions,which of the following statements
Q156: If you square the correlational coefficient,you will