Multiple Choice
The type of graph depicted below is a 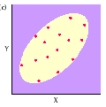
A) frequency polygon.
B) scatter diagram.
C) correlation matrix.
D) histogram.
Correct Answer:

Verified
Correct Answer:
Verified
Related Questions
Q195: Which of the following measures offset proportions
Q196: If the correlation between the IQs of
Q197: Which of the following is the largest
Q198: Which of the following measures of central
Q199: What percent of all cases are found
Q201: Groups of scores from distributions that are
Q202: If the mean on a test is
Q203: Which of the following is the simplest
Q204: Which of the following correlation coefficients indicates
Q205: The more time students spend sleeping in