Multiple Choice
The scatter diagram below depicts which type of relationship? 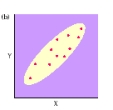
A) zero correlation.
B) positive relationship.
C) variable relationship.
D) negative relationship.
Correct Answer:

Verified
Correct Answer:
Verified
Related Questions
Q61: If the mean of a test is
Q62: When two variables vary together in some
Q63: Which of the following is the index
Q64: The 25 students in the psychology class
Q65: When a psychologist wishes to generalize results
Q67: There are ten students in the pre-kindergarten
Q68: On his psychology test,Miguel must determine what
Q69: One's shoe size and one's IQ score
Q70: When we want to generalize from the
Q71: For the numbers 10,19,2,9,and 15,the range is<br>A)