Multiple Choice
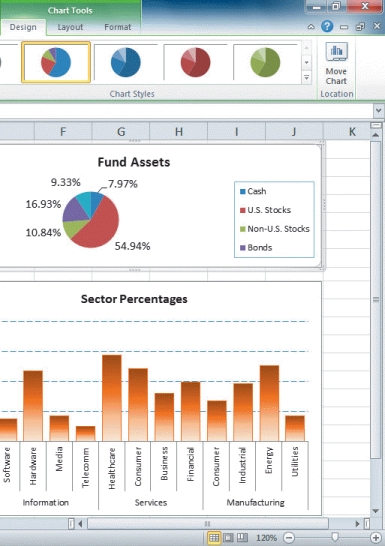
-Referring to the figure above,in the column chart,the values along the left side (0.00%,5.00%,etc. ) are ____.
A) plot markers
B) plot marks
C) data markers
D) tick marks
Correct Answer:

Verified
Correct Answer:
Verified
Related Questions
Q35: Since scientific data is often plotting two
Q47: _ extend the tick marks across the
Q48: In a pie chart,the largest piece of
Q50: The _ Chart Tools contextual tabs appear
Q51: Excel supports the following three types of
Q51: To compare values from several categories with
Q53: Increasing the rotation horizontally in a 3-D
Q55: MATCHING<br>Identify the letter of the choice that
Q57: A chart style is similar to a
Q63: MATCHING<br>Identify the letter of the chart type