menu-iconExamlexExamLexServices

Discover

Ask a Question
  1. All Topics
  2. Topic
    Computing
  3. Study Set
    New Perspectives on Microsoft Excel
  4. Exam
    Exam 4: Enhancing a Workbook With Charts and Graphs
  5. Question
    -In the Above Figure,the Data Markers Shown in the Cells
Solved

-In the Above Figure,the Data Markers Shown in the Cells

Question 64

Question 64

Multiple Choice

  -In the above figure,the data markers shown in the cells in the column labeled  Performance,  are ____. A)  data lines B)  sparklines C)  data bars D)  spark bars
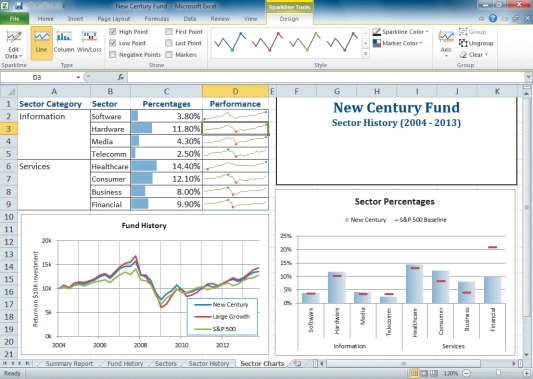
-In the above figure,the data markers shown in the cells in the column labeled "Performance," are ____.


A) data lines
B) sparklines
C) data bars
D) spark bars

Correct Answer:

verifed

Verified

Unlock this answer now
Get Access to more Verified Answers free of charge

Related Questions

Q59: You can add visual interest to charts

Q60: Case-Based Critical Thinking Questions<br>Case 4-2<br>Anya has just

Q61: To add an axis to a sparkline,click

Q62: You can rotate a 3-D chart along

Q63: <img src="https://d2lvgg3v3hfg70.cloudfront.net/TB5278/.jpg" alt=" -Referring to the

Q65: In Excel,charts do not remain linked or

Q66: After you select the data source,Excel determines

Q67: Which of the following represents a range

Q68: If you cannot find the right chart

Q69: Which of the following represents the pointer

Examlex

ExamLex

About UsContact UsPerks CenterHomeschoolingTest Prep

Work With Us

Campus RepresentativeInfluencers

Links

FaqPricingChrome Extension

Download The App

Get App StoreGet Google Play

Policies

Privacy PolicyTerms of ServiceHonor CodeCommunity Guidelines

Scan To Download

qr-code

Copyright © (2025) ExamLex LLC.

Privacy PolicyTerms Of ServiceHonor CodeCommunity Guidelines