Multiple Choice
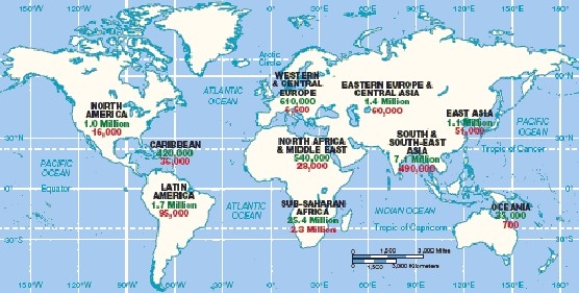
-The statistics on the above map represent people living with and dying from
A) HIV/AIDS.
B) famine.
C) war.
D) internal displacement.
E) diasporas.
Correct Answer:

Verified
Correct Answer:
Verified
Related Questions
Q167: Match the population characteristics to the groups
Q168: In general,_ has/have the highest crude birth
Q169: Whereas Marx believed the equitable distribution would
Q170: When discussing why people have migrated from
Q171: According to the demographic transition,societies are more
Q173: As of 2013,the global population was over<br>A)
Q174: The Canadian baby boom echo is a
Q175: Use examples in a short discussion of
Q176: From Australia to Mexico,from Bangladesh to Egypt,the
Q177: When the sizable baby boom cohort became