Multiple Choice
Use the following diagram to answer the following questions.
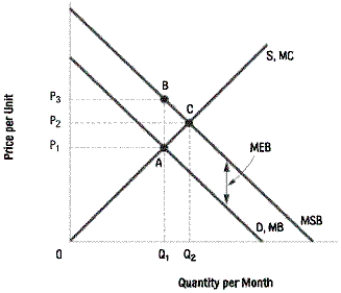
-Refer to Diagram 4-2. In the above diagram, counting the external benefits increases total costs by area:
A) Q₁BCQ₂
B) Q₁ACQ₂
C) ABC
D) P₁AQ₁
Correct Answer:

Verified
Correct Answer:
Verified
Related Questions
Q15: Marginal social cost refers to the <br>A)
Q35: The total benefits derived from consumption is
Q36: The monopolist will set the price at
Q37: The cost to producers when they produce
Q38: Use the following diagram to answer the
Q39: Use the following diagram to answer the
Q41: Income taxes result in allocative inefficiency because
Q42: The total cost of production is measured
Q44: Suppose a market is currently producing at
Q45: Allocative efficiency exists when net benefit is