Multiple Choice
Use the following diagram to answer the following questions.
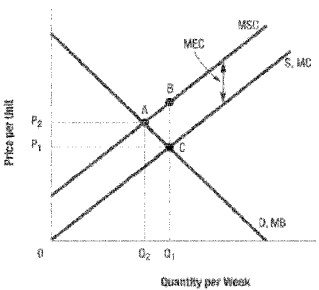
-Refer to Diagram 4-3. In the above diagram the competitive level of output is:
A) Q₁
B) Q₂
C) P3
D) C
Correct Answer:

Verified
Correct Answer:
Verified
Related Questions
Q28: The area under the demand curve represents
Q29: The benefit consumers receive when they consume
Q30: If marginal social cost is greater than
Q31: Government rent controls promote efficiency and equity.
Q32: A competitive industry usually produces the efficient
Q34: Suppose that at current production levels, marginal
Q35: The total benefits derived from consumption is
Q36: The monopolist will set the price at
Q37: The cost to producers when they produce
Q38: Use the following diagram to answer the