Multiple Choice
Use the following diagram to answer the following questions.
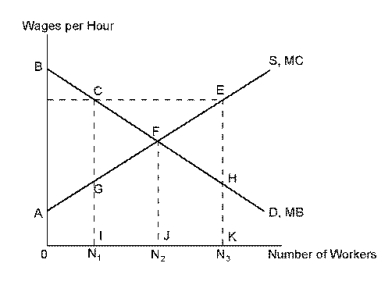
-Refer to Wages. Employment loss from government imposing a minimum wage is given by:
A) N1.
B) N2.
C) N3-N1.
D) N2-N1.
Correct Answer:

Verified
Correct Answer:
Verified
Related Questions
Q18: Pollution is an example of external costs.
Q19: Use the following diagram to answer the
Q20: The supply curve represents the marginal cost
Q21: Use the following diagram to answer the
Q22: Which of the following is NOT an
Q24: In determining the efficient amount of a
Q25: Which of the following is NOT an
Q26: Government subsidized medical care results in inefficiently
Q27: Use the following diagram to find the
Q28: The area under the demand curve represents