Multiple Choice
Use the following diagram to answer the following questions.
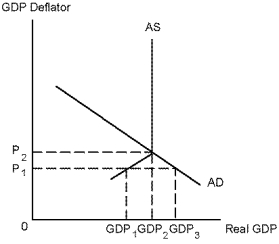
-Refer to Diagram 12-1. Suppose the price level in the above graph is currently P₁. In this instance, the economy would most likely be experiencing:
A) a depression.
B) recession.
C) an excess supply of goods and services.
D) an excess demand for goods and services.
Correct Answer:

Verified
Correct Answer:
Verified
Q47: Suppose the wage rate decreases. As a
Q48: Suppose nominal GDP for 1998 is $9,900
Q49: Which of the following is likely to
Q50: Unemployment increases during the expansion phase of
Q51: Fiscal policy refers to:<br>A) changes in the
Q53: Which of the following would be considered
Q54: The aggregate supply curve shows:<br>A) the total
Q55: Suppose the economy is currently producing at
Q56: The equilibrium level of real GDP occurs
Q57: Use the following diagram to answer the