Multiple Choice
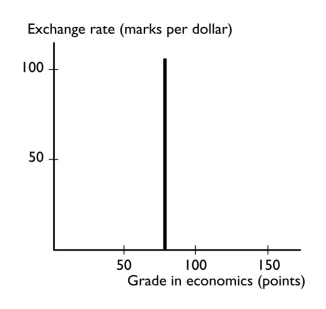
-The graph shows
A) positive relationship that becomes less steep.
B) negative relationship that is linear.
C) positive relationship that is linear.
D) no relationship between the variables.
E) a trend relationship between the variables.
Correct Answer:

Verified
Correct Answer:
Verified
Q18: If there is no scarcity,<br>A) the opportunity
Q32: The _ of something is the gain
Q130: Suppose you eat two hamburgers for lunch.The
Q144: Ceteris paribus when graphing a relationship refers
Q148: <img src="https://d2lvgg3v3hfg70.cloudfront.net/TB1458/.jpg" alt=" -In the figure
Q208: When Ferrari decides to produce 1,200 360
Q211: The additional benefit of increasing some activity
Q302: Which of the following statements is a
Q303: A steep slope in a time series
Q319: The slope of a line equals the