Multiple Choice
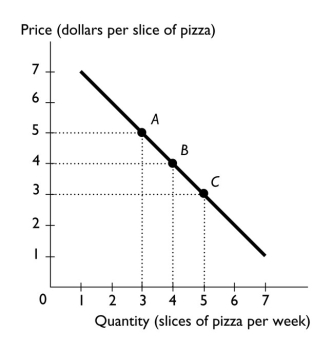
-The above figure shows the relationship between the price of a slice of pizza and how many slices of pizza Ricardo buys in a week.Between points A and B,the slope of the line equals
A) -5.
B) -4.
C) -3.
D) -1.
E) -2
Correct Answer:

Verified
Correct Answer:
Verified
Q214: Ali decides to attend the one-hour review
Q215: Which of the following statements is true
Q216: <img src="https://d2lvgg3v3hfg70.cloudfront.net/TB1458/.jpg" alt=" -In the diagram
Q217: Which of the following statements is correct?<br>A)
Q218: Which of the following is true regarding
Q220: <img src="https://d2lvgg3v3hfg70.cloudfront.net/TB1458/.jpg" alt=" -To graph a
Q221: When Delta decides to quit flying to
Q222: Which of the following is an example
Q224: In the diagram below,draw a straight line
Q382: Define marginal cost and marginal benefit.