Multiple Choice
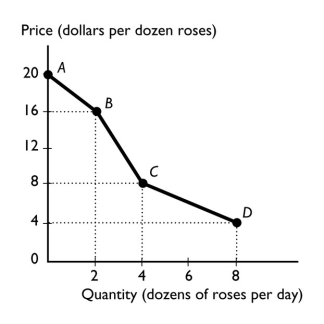
-The figure above shows the relationship between the price of a dozen roses and the quantity of roses a florist can sell.The slope between points A and B is
A) 20.
B) 16.
C) 2.
D) 4
E) nonexistent because at point A, 0 roses are sold.
Correct Answer:

Verified
Correct Answer:
Verified
Related Questions
Q21: <img src="https://d2lvgg3v3hfg70.cloudfront.net/TB1458/.jpg" alt=" -In the figure
Q35: To show how a variable _,we typically
Q77: When a home builder decides to computerize
Q102: A scatter diagram can be used to
Q127: Jamie has enough money to buy either
Q221: When Delta decides to quit flying to
Q228: If a curve rises and then falls,it
Q268: As the number of days without rain
Q294: We are investigating the relationship among three
Q311: The opportunity cost of a decision is