Multiple Choice
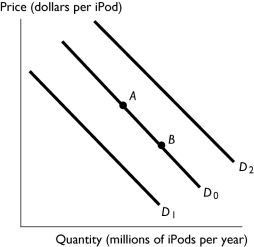
-The figure above shows the market for iPods.Which of the following shifts the demand curve from D₀ to D₂?
A) A decrease in the price of Zunes, a substitute for iPods.
B) An increase in the price of iPods.
C) A requirement that all students at universities have an iPod.
D) A decrease in the price of iPods.
E) A decrease in people's incomes if iPods are a normal good.
Correct Answer:

Verified
Correct Answer:
Verified
Q4: Ramen noodles are a staple food item
Q14: <img src="https://d2lvgg3v3hfg70.cloudfront.net/TB1458/.jpg" alt=" -Scooters and bicycles
Q33: The downward slope of a demand curve<br>A)
Q47: The impact of an increase in the
Q54: <img src="https://d2lvgg3v3hfg70.cloudfront.net/TB1456/.jpg" alt=" -Using the data
Q113: <img src="https://d2lvgg3v3hfg70.cloudfront.net/TB1454/.jpg" alt=" -The figure above
Q143: <img src="https://d2lvgg3v3hfg70.cloudfront.net/TB1458/.jpg" alt=" -In the above
Q249: Suppose that the equilibrium price and quantity
Q258: EBay<br>A) will be considered a market when
Q260: Which of the following increases the supply