Multiple Choice


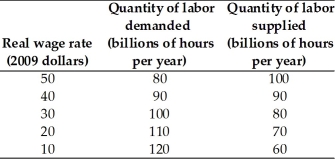
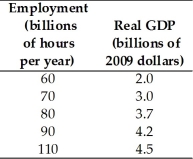
-The tables above show a nation's labor demand and labor supply schedules and its production function.The equilibrium real wage rate is ________ and the equilibrium quantity of labor is ________ billion hours per year.
A) $50;100
B) $40;90
C) $30;80
D) $40;80
E) $20;110
Correct Answer:

Verified
Correct Answer:
Verified
Q87: Encouraging international trade will<br>A)slow economic growth when
Q89: Suppose that an Intel worker rearranges existing
Q90: The productivity curve is a relationship between
Q91: The real wage rate is the _
Q93: A key reason why some nations show
Q94: Property rights assure people that<br>A)the government will
Q95: A reason why many of the third
Q96: If real GDP was $13.1 trillion in
Q97: Activities that encourage faster growth are<br>A)high levels
Q187: Define labor productivity. Discuss the relationship between