Multiple Choice
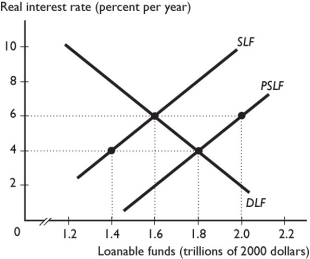
-In the figure above, the SLF curve is the supply of loanable funds curve and the PSLF curve is the private supply of loanable funds curve.The equilibrium interest rate is ________ percent and the equilibrium quantity of loanable funds is ________.
A) 6; $1.6 trillion
B) 6; $2.0 trillion
C) 4; $1.4 trillion
D) 4; $1.8 trillion
E) 4; $2.0 trillion
Correct Answer:

Verified
Correct Answer:
Verified
Q222: Which of the following are typically financed
Q223: An increase in the real interest rate<br>A)
Q224: When a student uses a credit card
Q225: How do each of the following shift
Q226: An increase in the quantity of loanable
Q228: If the real interest rate rises, then
Q229: In 2010, the U.S.federal government had a
Q230: <img src="https://d2lvgg3v3hfg70.cloudfront.net/TB1454/.jpg" alt="
Q231: The quantity of loanable funds demanded increases
Q232: Which of the following shifts the supply