Multiple Choice
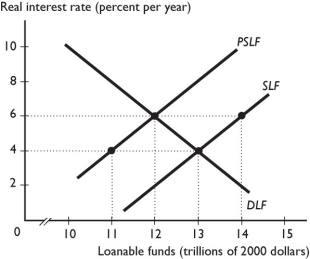
-In the figure above, the SLF curve is the supply of loanable funds curve and the PSLF curve is the private supply of loanable funds curve.If there is no Ricardo-Barro effect, the figure shows a situation in which the government has a budget
A) surplus of $2 trillion.
B) deficit of $2 trillion.
C) surplus of $14 trillion.
D) deficit of $11 trillion.
E) surplus of $12 trillion.
Correct Answer:

Verified
Correct Answer:
Verified
Q114: Does a change in the real interest
Q186: A decrease in people's disposable income<br>A) increases
Q187: <span class="ql-formula" data-value="\begin{array} { c c c
Q188: Economists use the term "financial markets" to
Q189: If wealth _, then saving increases, which
Q191: If there is no Ricardo-Barro effect, an
Q192: The crowding-out effect describes how a government
Q193: The "crowding-out effect" refers to how a
Q194: A bond's price is $80 and the
Q195: If the real interest rate falls, other