Multiple Choice
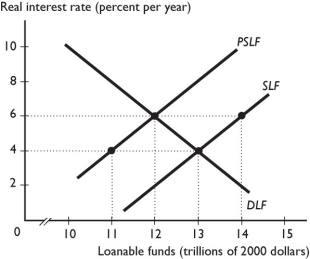
-In the figure above, the SLF curve is the supply of loanable funds curve and the PSLF curve is the private supply of loanable funds curve.The equilibrium interest rate is ________ percent and the equilibrium quantity of loanable funds is ________.
A) 6; $12 trillion
B) 6; $14 trillion
C) 4; $13 trillion
D) 4; $11 trillion
E) 4; $14 trillion
Correct Answer:

Verified
Correct Answer:
Verified
Q84: Evidence to support the Ricardo-Barro effect would
Q85: If there is no Ricardo-Barro effect, an
Q86: The Ricardo-Barro effect refers to how _
Q87: Which of the following is NOT an
Q88: At the beginning of the year, Becky's
Q90: During financial crisis of 2008-09, the government
Q91: An increase in disposable income leads to
Q92: A country initially has an equilibrium real
Q93: Economists use the term wealth to mean<br>A)
Q94: Suppose firms become more optimistic about the