Multiple Choice
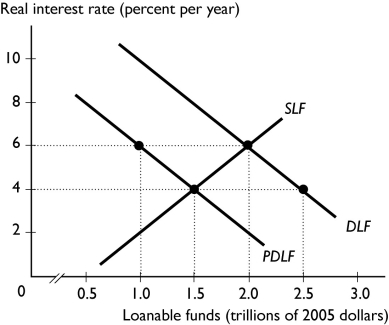
-In the figure above, the DLF curve is the demand for loanable funds curve and the PDLF curve is the private demand for loanable funds curve.If there is no Ricardo-Barro effect, the figure shows the situation in which the government has a ________ so that the equilibrium real interest rate is ________ and the equilibrium quantity of investment is ________.
A) budget surplus; 4 percent; $1 trillion
B) budget deficit; 4 percent; $1 trillion
C) budget deficit; 6 percent; $1.5 trillion
D) budget surplus; 6 percent; $1.5 trillion
E) balanced budget; 6 percent; $1.5 trillion
Correct Answer:

Verified
Correct Answer:
Verified
Q110: In the late 1990s, the U.S.federal government
Q111: A decrease in expected future income leads
Q112: The tendency for higher government budget deficits
Q113: Federal Express's purchase of trucks and planes<br>A)
Q114: When wealth _, saving supply _ and
Q116: <img src="https://d2lvgg3v3hfg70.cloudfront.net/TB1454/.jpg" alt=" The figure
Q117: An example of financial capital is<br>A) machines.<br>B)
Q118: A fall in the real interest rate
Q119: In 2009, which of the following events
Q120: A stockholder _ an owner of the