Multiple Choice
10.4 Chapter Figures
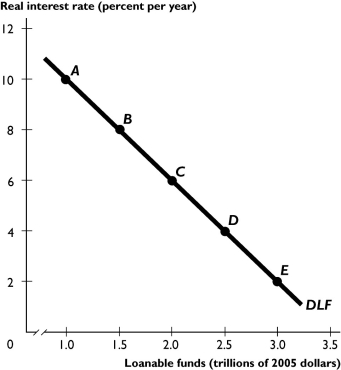
The figure above shows the demand for loanable funds curve.
-If the demand curve for loanable funds shifts rightward from the curve shown in the figure above, the shift could be the result of
A) an increase in expected profit.
B) a decrease in expected profit.
C) a rise in the real interest rate.
D) a fall in the real interest rate.
E) a decrease in real GDP.
Correct Answer:

Verified
Correct Answer:
Verified
Q244: Explain the relationship between the real interest
Q245: "A government surplus can decrease investment through
Q246: <span class="ql-formula" data-value="\begin{array} { c c c
Q247: If firms became more optimistic about the
Q248: The crowding-out effect is the tendency for<br>A)
Q250: When disposable income increases, saving will<br>A) decrease
Q251: Discuss why a budget deficit results in
Q252: If the real interest rate decreases, people
Q253: An increase in wealth _ saving supply
Q254: When the expected profit _, investment demand