Multiple Choice
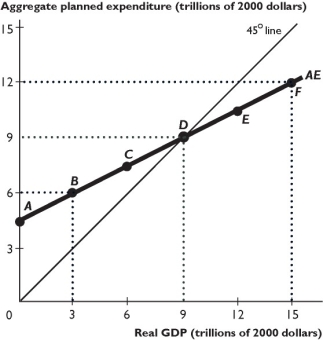
The figure above shows a nation's aggregate expenditure curve.
-At which of the following points is the unplanned inventory change the largest positive amount?
A) point B
B) point C
C) point D
D) point E
E) point F
Correct Answer:

Verified
Correct Answer:
Verified
Q101: If disposable income decreases during a recession,
Q102: What is the relationship between the slope
Q103: In an economy in with no income
Q104: The components of aggregate expenditure that are
Q105: A change in the price level<br>A) shifts
Q108: On a graph of the consumption function,
Q109: As real GDP _, aggregate planned expenditure
Q110: The relationship between disposable income and consumption
Q111: <img src="https://d2lvgg3v3hfg70.cloudfront.net/TB1454/.jpg" alt=" -The above table
Q188: If unplanned inventory changes are positive, what